Thursday, November 19, 2009
Sidus system strategy
Sidus system is one of most popular and efficient system trading among forex traders to reached success earning in forex. it can be used as determinant currently trend for long or short therm. this system also is combined results of BGX system and Vegas system which are quite popular system.
Applicatian this system is suggested to use currency pair EUR/USD and EUR/GBP (select one pair) and used this system when europe market open (14.00 WIB) or us market open(19.00 WIB).
some important indicators to support this system consist of:
-Time frame 1H use candlestic chart or bar chart type.
-EMA 18 and EMA 28 (both are red color) as tunnel
-WMA 5 (blue color) and WMA 8 (yellow color)
*about color can chose it as you like.
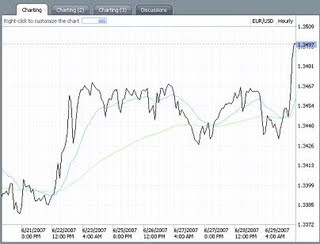
way to setup those indicators on marketiva, say you have logged in to streamster marketiva account:
setup timeframe 1 hour and candlestick chart or bar chart
-On main chart, right click it then will appear context menu say "time scale" select it and then chose "hourly" then grafic will representing price (open, close, high, low) every 1 hour, every chart update.
-Still on main chart, right click again on it then chose "style" and select "candlestick chart" or "bar chart"
setting EMA 18 and EMA 28 ( red color)
-On main chart, right click it, will appear context menu, select "indicators" then chose "moving average", fill the type being "Exponential" (EMA=Exponential moving average), change default period to "18" after that change the color click"line color" to red color.
-do the same as above for EMA 28.
now you have two lines with red color on chart, each as EMA 18 and EMA 28
setting WMA 5 (blue) and WMA 8 (yellow)
-On main chart , right click it then appear context menu , select "indicators" then selsct 'moving average", chose the type "weighted" (WMA=Weightedl Moving Average), change default period to 5 for WMA 5 and change period to 8 for WMA 8. and click line color to blue for WMA 5 and to yellow for WMA 8
now you have four lines on chart are EMA 18, EMA 28,WMA 5,WMA 8 ,save the chart and give a name any, such as: "sidus system", this is useful for future login on streamster marketiva you dont need to resetup it.
Application of this system trading:
EMA 18 and EMA 28:are as two tunnel lines which help you to determine when the trend has been starting and when the trend has been ending in long therm.
WMA 5 and WMA 8: are two lines will help you to determine when you have to entry to market and when you have to exit from the market. and these lines also can be used to predict the strength of the trend (short therm).
Entry signal:
Do entry position (buy or sell) only both lines of tunnel (EMA 18 and EMA 28) began to intersect or began to narrow.
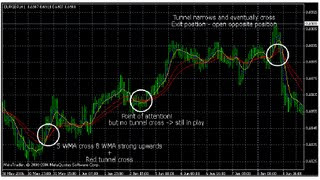
Take Buy position if WMA-5 and WMA-8 crosses up the tunnel lines (EMA 18 and EMA 28) from under tunnel across to above it.
Take Sell position if WMA-5 and WMA-8 crosses the tunnel lines (EMA 18 and EMA 28) from above tunnel crosses to under it.
Exit position signal
if you have buy position, be carefull if WMA-5 crosses down through WMA-8 and exit position when WMA-5 and WMA-8 move down through tunnel line (EMA-18 and EMA-28)from top to bottom.
otherwise, if you have sell position, be carefull if WMA-5 crosses up through WMA-8 and exit position when WMA-5 and WMA-8 together crosses up through tunnel line(EMA-8 and EMA-28) from bottom to top.
And always exit your postion whatever that if tunnel line (EMA-8 and EMA-28) moved closer to each other even being cross shape , it shows change of trend will be hapened.
(read: trend reversal). in this case, you should reverse the posistion of the previous. remember, Make the trend as a friend.
example image :
Wednesday, November 18, 2009
Pivot points
Pivot point is arithmetic calculation result which used traders to determine Support level and Resistance level as guide tool, however pivot point is still included technical analysis branch due to based of previous prices projection.
Pivot point analysis
According to analysis pivot point has two tendencies, if daily open price openned at above pivot point , then the prices always above that point till touch the ressistance line, otherwise if daily open price openned at under pivot points, then the prices always there untill touch the support line. when it is not afford to through Ressistance 1 then it will tend back to Support 1. otherwise when it is not afford to through support 1 then it will tend to Ressistance 1.
Ressistance is the point above pivot point where the price tend moves back when touch or close this line. support is the point under the pivot points where the price touch or close this line will tend go back moves up.
If the market openned at or near R2 or S2 then the price tend go back moves to pivot point.
Pivot points calculation
The calculation of pivot points is based of H,L,O,C (High,Low,Open,Close) prices which get from average yesterday data, its for daily pivot, but for weekly pivot you can get weekly average data.
In marketiva account you can get the data by candlestick chart style in daily timeframe,
get the previous candle and measure H,L,C,O as image above, one up candestick and other down candlestick.
Forex market openned 24 hours the closing market usually based on Eastern time (EST) at 5.00 pm or 24.00 wib.
At the formula bellow H=High price, L=Low price , C=Close O=Open at yesterday session.
Pivot Point = (H+L+C)/3
Resistance Level 1 = (2*PP)-L
Support Level 1 = (2*PP)-H
Resistance Level 2 = (PP-S1) + R1
Support Level 2 = PP – (R1 – S1)
Resistance Level 3 = (PP-S2)+R2
Support Level 3 = PP – (R2-S2)
middle point as:
M1= (S2+S1)/2
M2= (S1+PP)/2
M3 = (R1+PP)/2
M4 = (R2+R1)/2
BGX system trading strategy
BGX is short name of BunnyGirl Trading Cros Framework, BunnyGirl is as a username who had ever been active in trader community forum such as Moneytec.com and StrategyBuilderFX.com. Bunnygirl explained this system in very detail and easy to be used in forex trading. And this strategy was proofed much help traders success in trading.
Best time to use this system is between 14.00 WIB - 24.00 WIB, when Europe market open and us market open.
Things to support this system such as:
-Timeframe 30 Minute use candlestick chart or bar chart type
-Indicator use WMA-5(Blue) , WMA-20(Orange) and WMA-100(Green), in the previous post sidus system have explained how to set this indicator.
-Indikator RSI-14 (default).
Setting these indicators on Marketiva account:
After login on marketiva account then you should see main chart bellow and set these above indicators.
BGX system strategy
1. Timeframe 30 Minute and candlestick chart or bar chart
-Right click on main chart will appear context menu find 'timescale' then select '30 Minutes' then chart will appear shows all (Open,Close,High,Low) update every 30 minutes.
-Right click again on main chart find "style" and select 'Candlestick chart' or 'Bar chart' its up to you. and chart will changes as you want.
2.WMA-5(Blue) WMA-20(Orange) and WMA-100(Green)
-Right click on main chart find 'indicators' chose 'Moving Average' then will appear tab at right fill type option to Weighted (WMA=Weightening Moving Average).
-Change default period column to 5 then click line color chose Blue color. click ok and now you have WMA-5 (Blue color).
-Do the same for WMA-20(Orange) and WMA-100(Green). Now you have WMA-5,WMA-20 and WMA-100.
3.Indicator RSi-14
-Right click on main chart find 'indicators' select "Relative Strenght Index (RSI)" fill 'period' column to 14. then save the chart to save just right click on chart select 'Save Chart' fill the name as you want.
Application of this strategy system :
-WMA-5(Blue) as price market follower.
-WMA-20(orange) as confrmation entry signal.
-WMA-100(Green) as daily trend indentification.
Prepared to take Buy position if:
-WMA-5 crosses up WMA-20 from bottom to top
-WMA-5 and WMA-20 placed above WMA-100
-RSI on above 50 (middle line)
-Do entry Buy position if the current price placed on 30 point through above WMA-5 and WMA-20 cross point.
Prepared to take Sell position if:
-WMA-5 crosses WMA-20 from top to bottom
-WMA-5 and WMA-20 placed under WMA-100
-RSI value under 50
-Do entry Sell position if current price has 30 point under WMA-5 and WMA-20 cross point.
Target point 30 pips and stop loss -5 from WMA-5 and WMA-20 cross point.
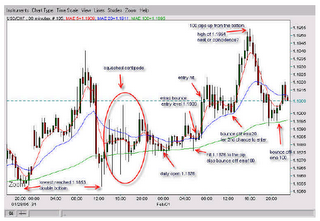
Example trading:
when WMA-5 and crosses up through WMA-20 at price 1.2530 and RSI 14 value shown above 50, take prepared to get Buy position, then take Buy position after price 30 pips move above 1.2530 (1.2530+0.0030(30 pip))is 1.2560 and put stoploss at 1.2525, 1.25.30-0.0005, under cross point.
Use demo account for practise.
Subscribe to:
Posts (Atom)